
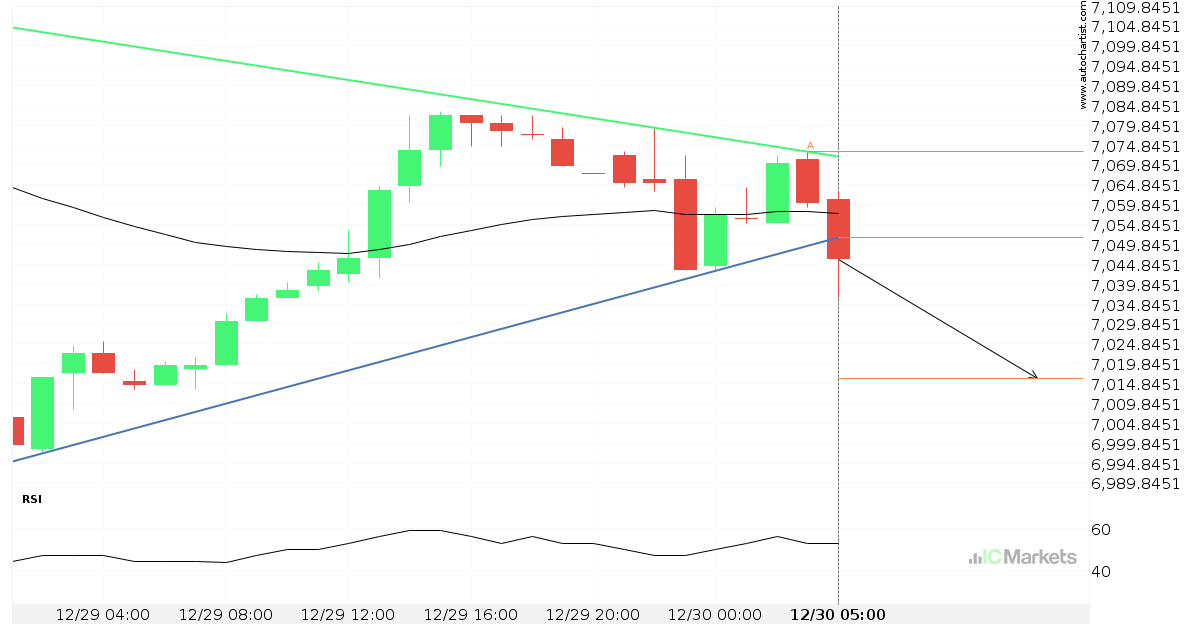
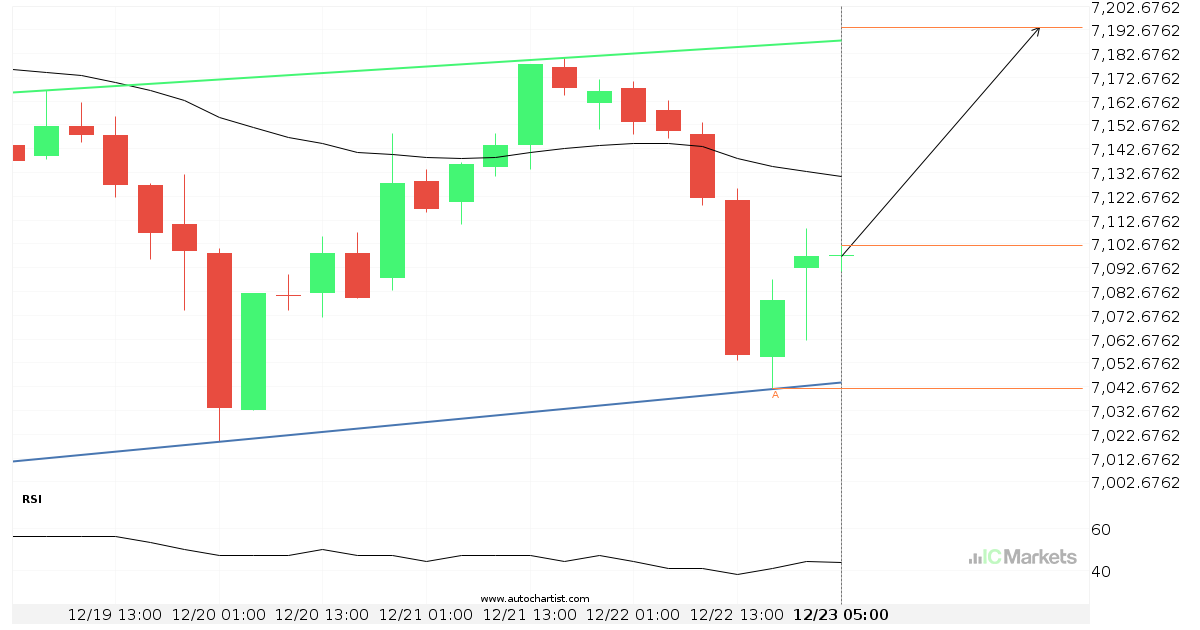
Australia 200 Index – support line breached
Australia 200 Index has broken through the support line of a Pennant technical chart pattern. Because we have seen it retrace from this line in the past, one should wait for confirmation of the breakout before taking any action. It has touched this line twice in the last 2 days and suggests a possible target […]
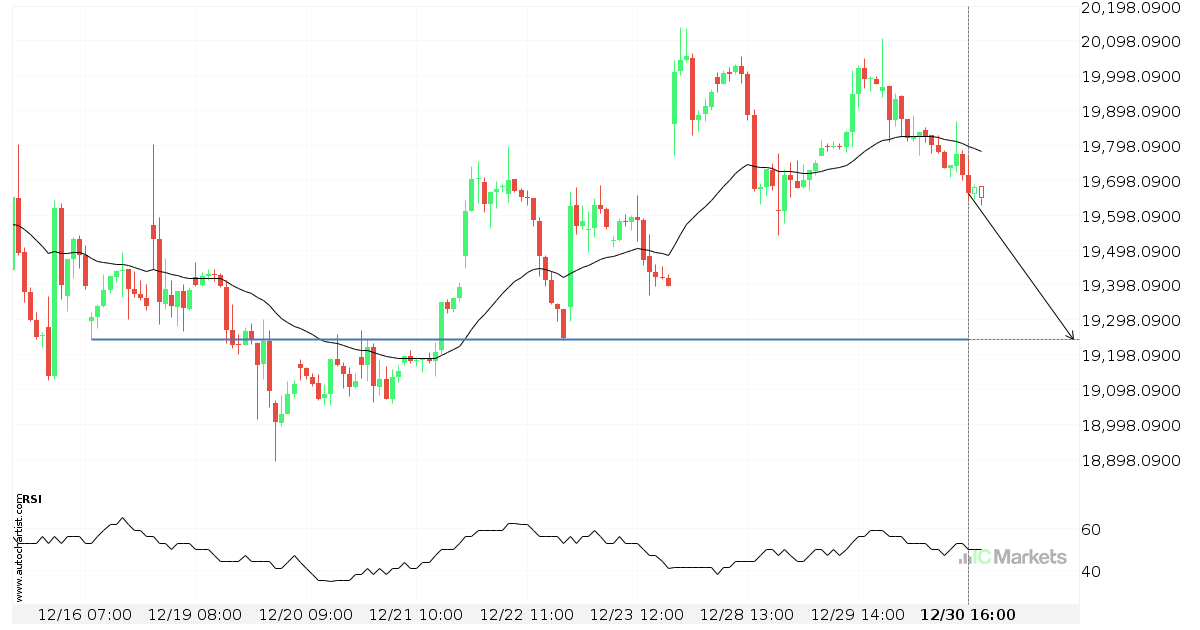
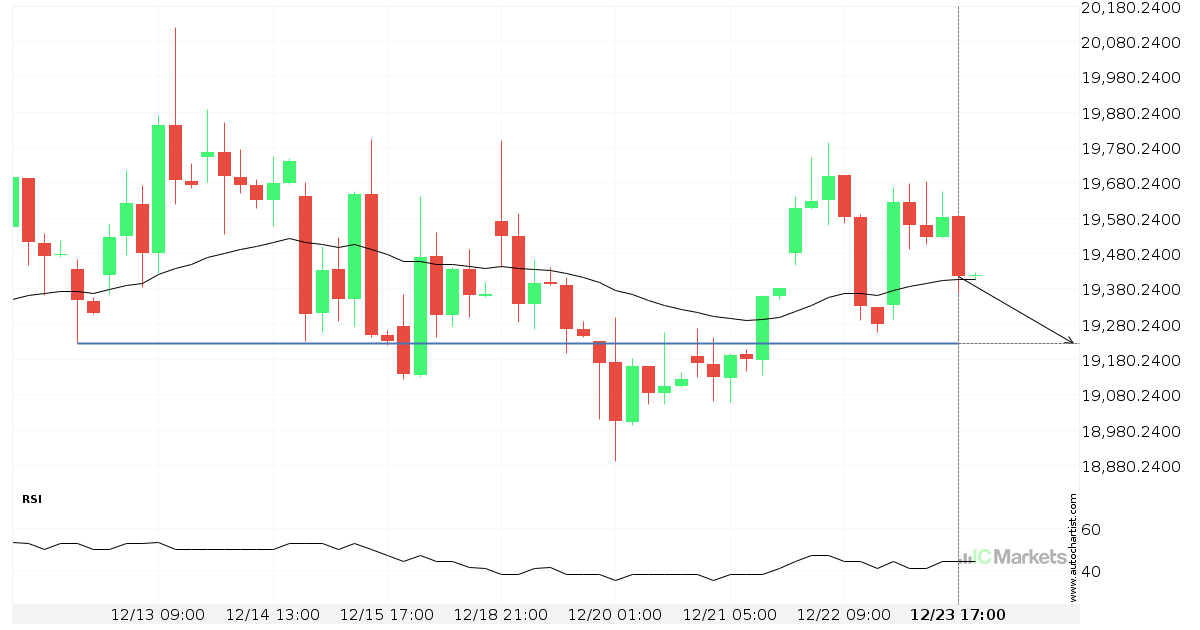
Either a rebound or a breakout imminent on Hong Kong 50 Index
Hong Kong 50 Index is heading towards a line of 19242.8008. If this movement continues, the price of Hong Kong 50 Index could test 19242.8008 within the next 2 days. But don’t be so quick to trade, it has tested this line numerous times in the past, so this movement could be short-lived and end […]
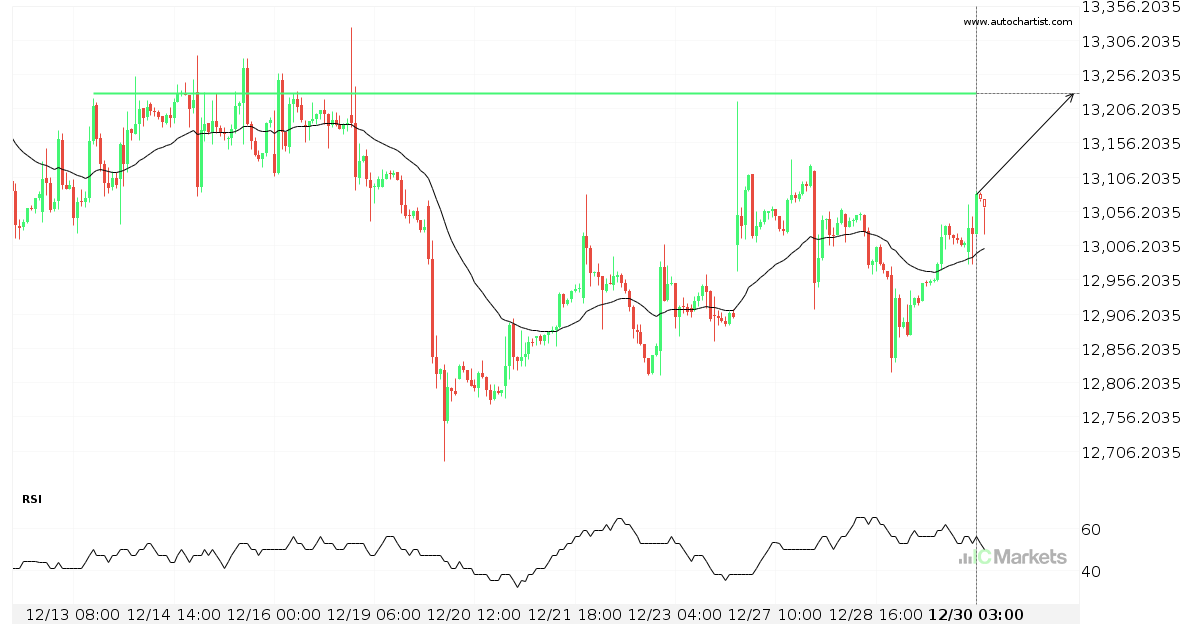
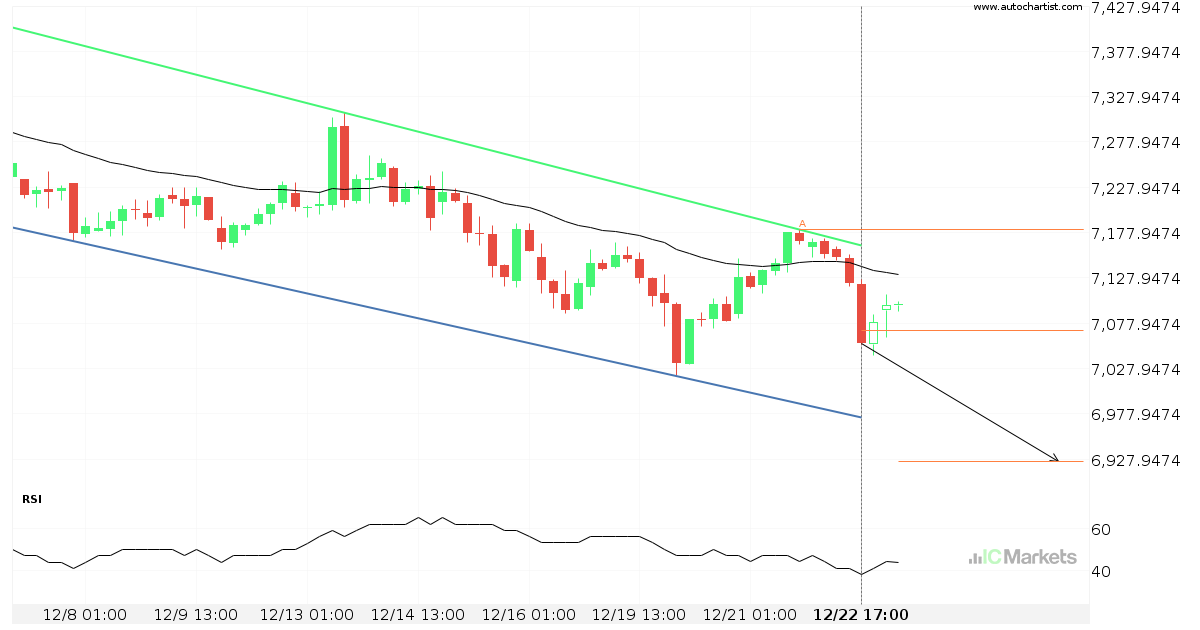
A final push possible on FTSE China A50 Index
FTSE China A50 Index is heading towards 13228.5498 and could reach this point within the next 3 days. It has tested this line numerous times in the past, and this time could be no different, ending in a rebound instead of a breakout. If the breakout doesn’t happen, we could see a retracement back down […]
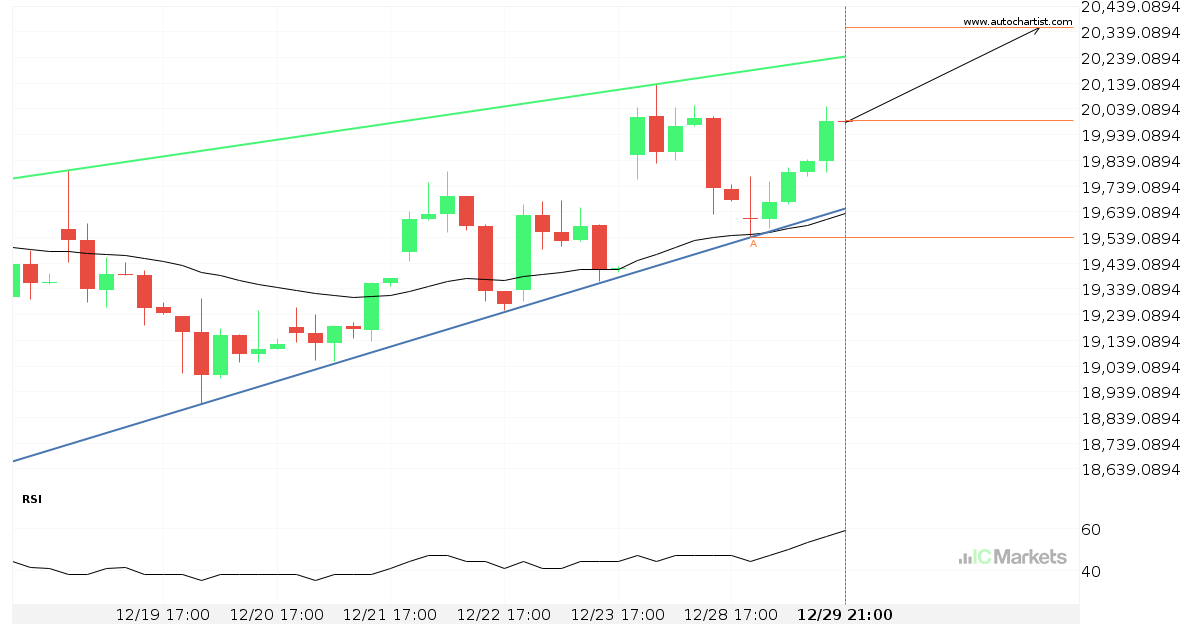
Either a rebound or a breakout imminent on Hong Kong 50 Index
Hong Kong 50 Index is heading towards the resistance line of a Rising Wedge. If this movement continues, the price of Hong Kong 50 Index could test 20354.7960 within the next 3 days. It has tested this line numerous times in the past, so this movement could be short-lived and end up rebounding just like […]
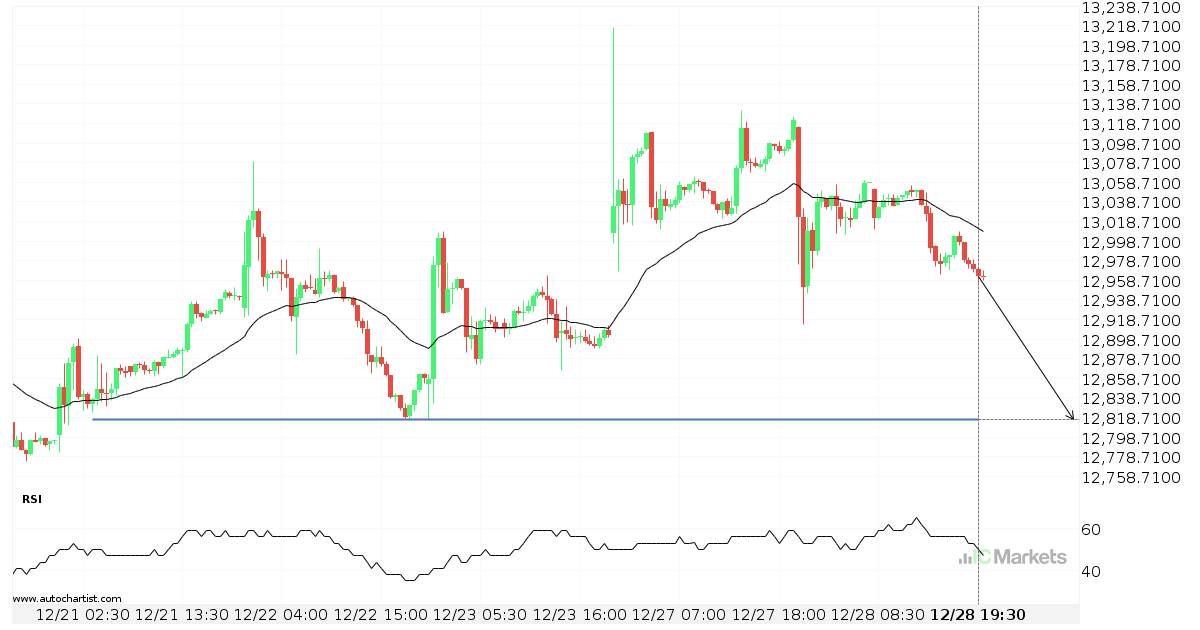
Either a rebound or a breakout imminent on FTSE China A50 Index
FTSE China A50 Index is heading towards a line of 12816.5898. If this movement continues, the price of FTSE China A50 Index could test 12816.5898 within the next 22 hours. But don’t be so quick to trade, it has tested this line numerous times in the past, so this movement could be short-lived and end […]
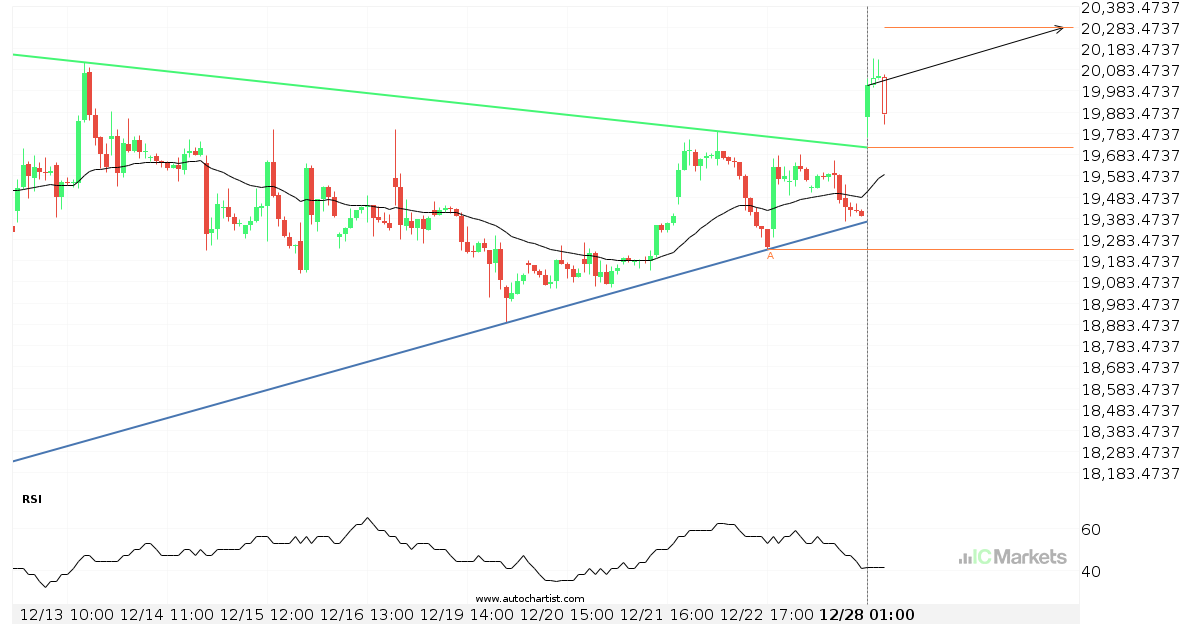
A possible start of a bullish trend on Hong Kong 50 Index
Hong Kong 50 Index has broken through a resistance line of a Triangle chart pattern. If this breakout holds true, we may see the price of Hong Kong 50 Index testing 20281.3285 within the next 2 days. But don’t be so quick to trade, it has tested this line in the past, so you should […]
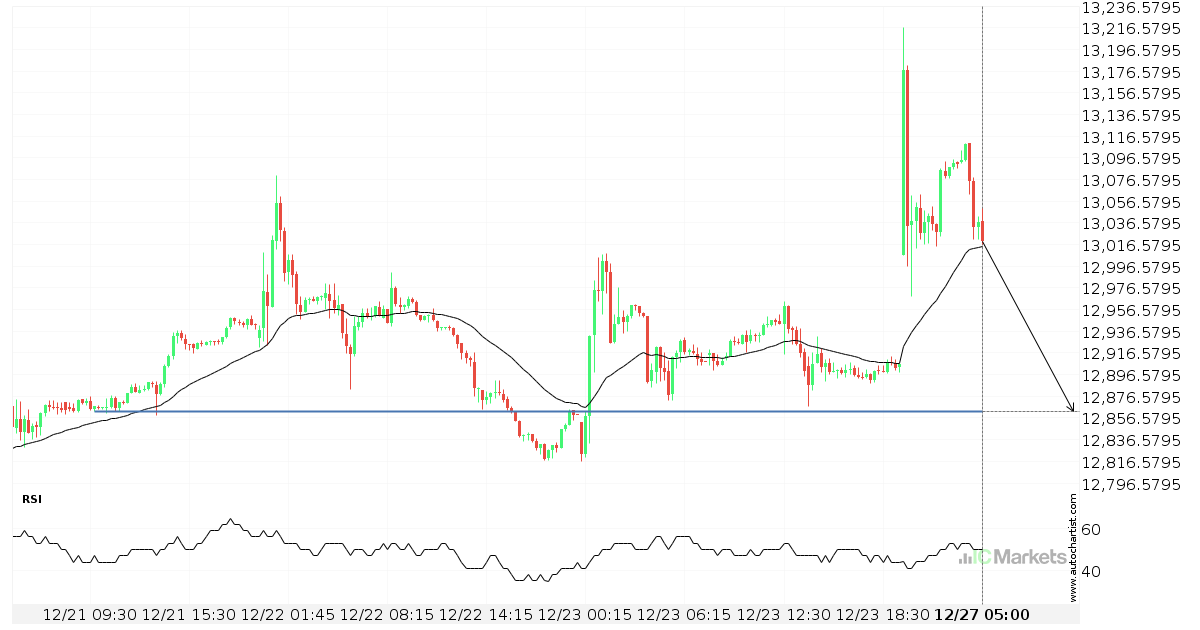
FTSE China A50 Index – getting close to psychological price line
FTSE China A50 Index is moving towards a support line. Because we have seen it retrace from this level in the past, we could see either a break through this line, or a rebound back to current levels. It has touched this line numerous times in the last 6 days and may test it again […]
Australia 200 Index approaching resistance of a Channel Up
Australia 200 Index is approaching the resistance line of a Channel Up. It has touched this line numerous times in the last 8 days. If it tests this line again, it should do so in the next 2 days.
Either a rebound or a breakout imminent on Hong Kong 50 Index
Hong Kong 50 Index is heading towards a line of 19224.0996. If this movement continues, the price of Hong Kong 50 Index could test 19224.0996 within the next 3 days. But don’t be so quick to trade, it has tested this line numerous times in the past, so this movement could be short-lived and end […]
Australia 200 Index approaching support of a Channel Down
Australia 200 Index is approaching the support line of a Channel Down. It has touched this line numerous times in the last 22 days. If it tests this line again, it should do so in the next 3 days.